

This team blog has been created to document our journey through the Sidehustle Data Analytics Bootcamp.
For the first week, we've been tasked with creating a product sales insight using Excel and Power BI, and then we went ahead and sourced our dataset from the Kaggle website.
Before performing analysis on the data, we cleaned the data by deleting unnecessary columns and changing the data type of each column header to the correct one using Power Query.
After cleaning, we loaded the data into PowerBI in order to carry on with the visualization. Visualisation of data is the art of telling a story with the data. We were able to visualize the sum of revenue by country, month, year, etc.
The key insights generated are explained more below.
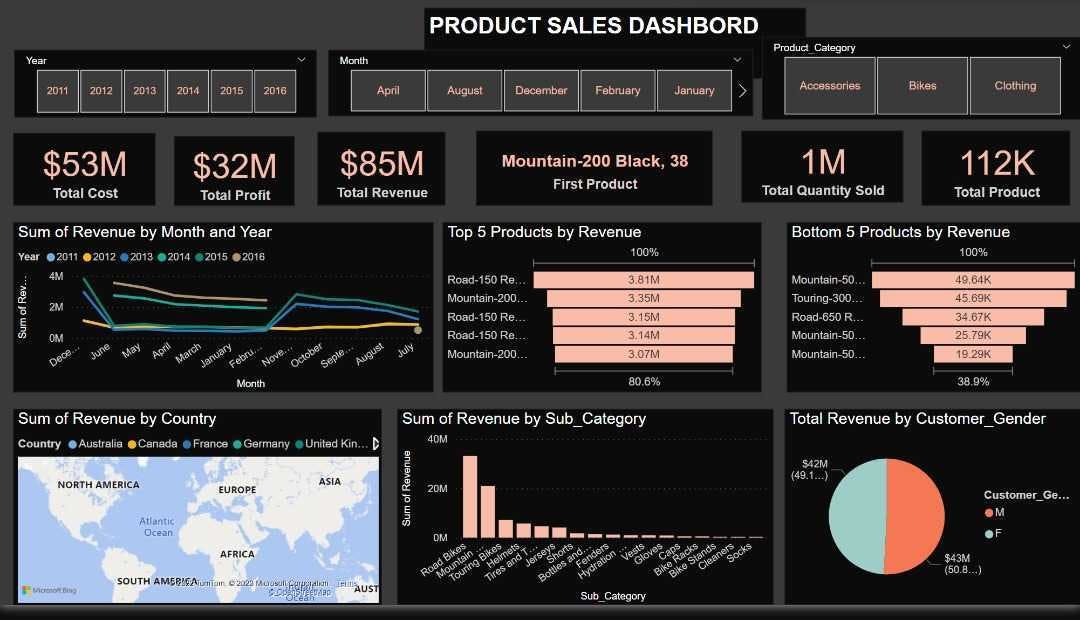
1. From 2011 to 2016, total revenues of $85 million were generated, with accumulated profits of $32 million. The total quantity sold was 1 million, with Mountain-200 Black, 38, receiving the first product with the highest profit.
2.Road bikes earned the highest revenue, followed by mountain bikes. It can also be noted that the male gender has 50.85% with $43 million in revenue and the female gender has 49.15% with $42 million in revenue. The company can utilize this analysis to target potential clients who will buy these products by running online advertisements. It will assist them in saving money.